The statistics for the selected Account or Portfolio are shown on the Portfolio Management page.
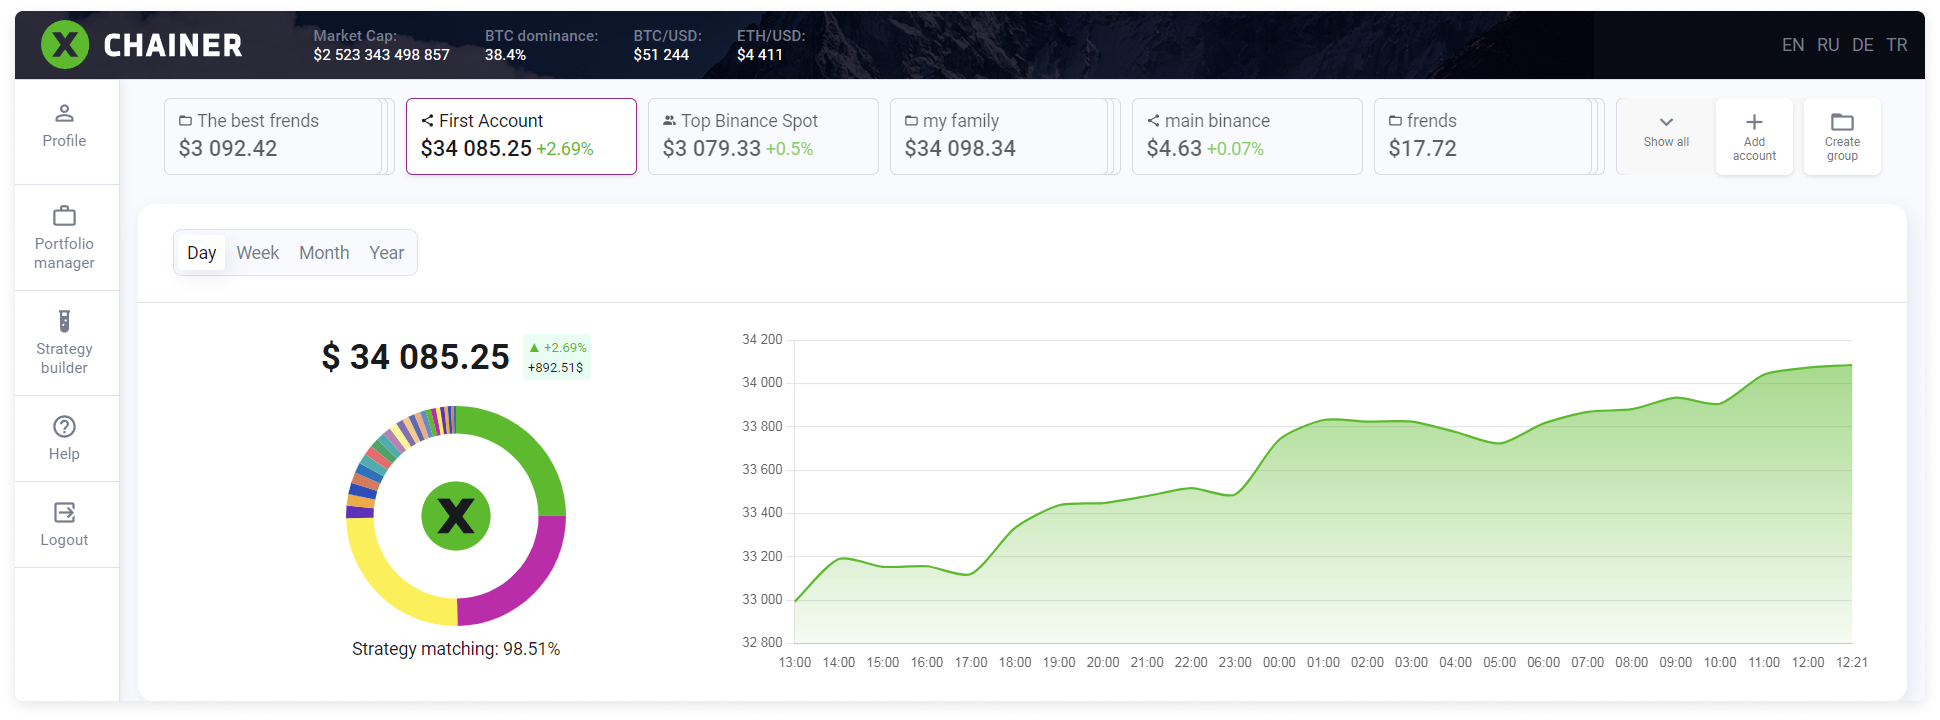
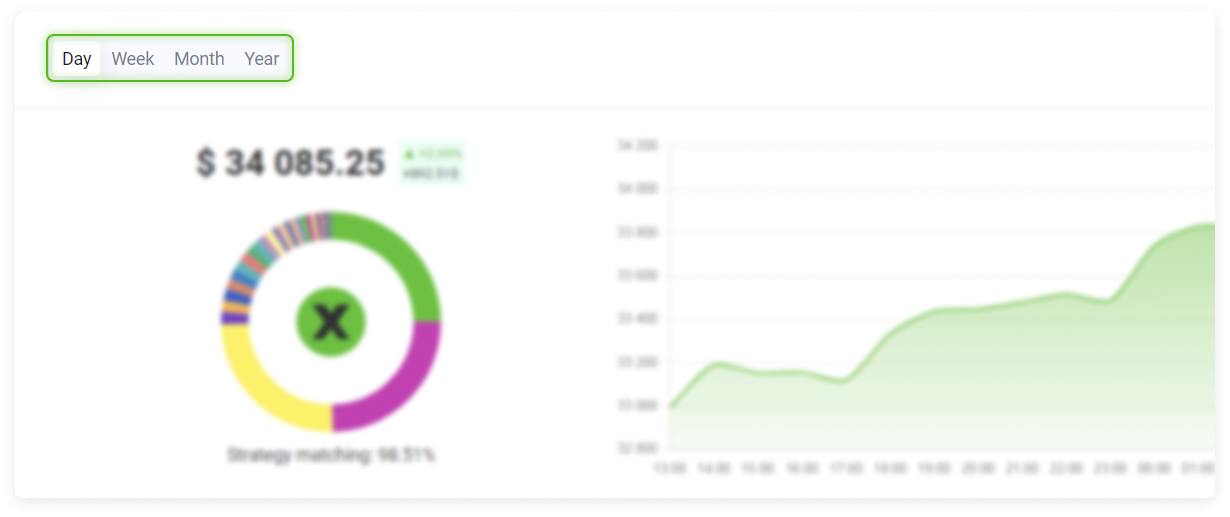
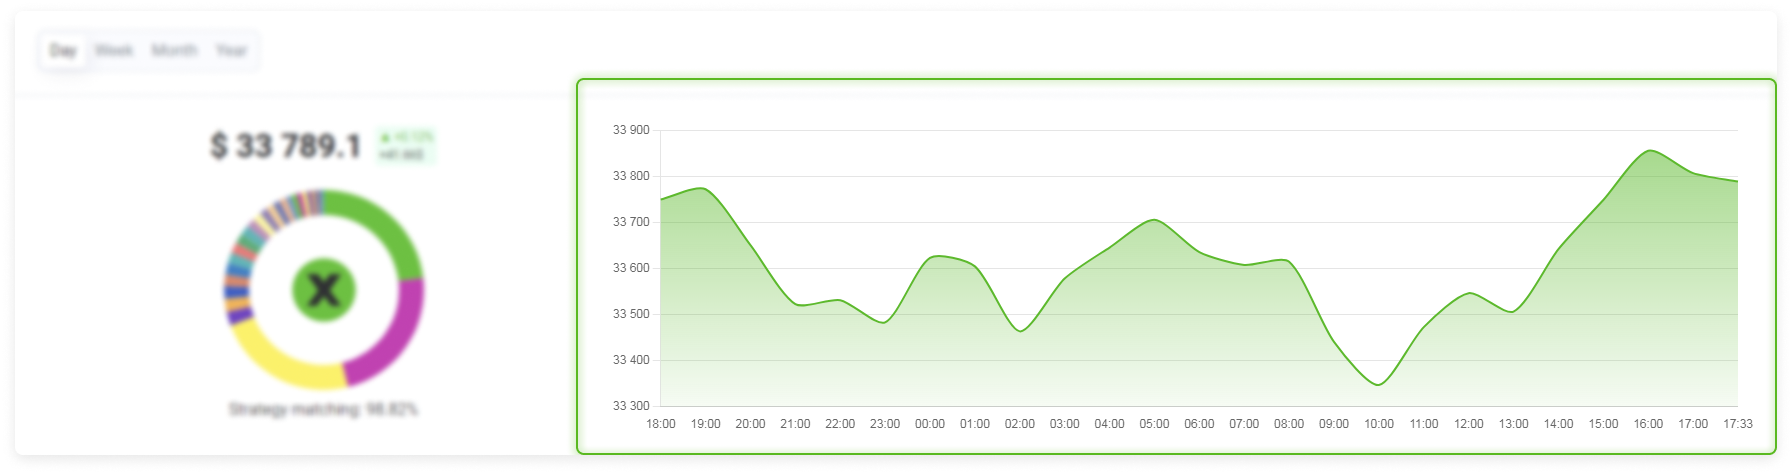
You can display information for one of the selected periods:
Day
Week
Month
Year
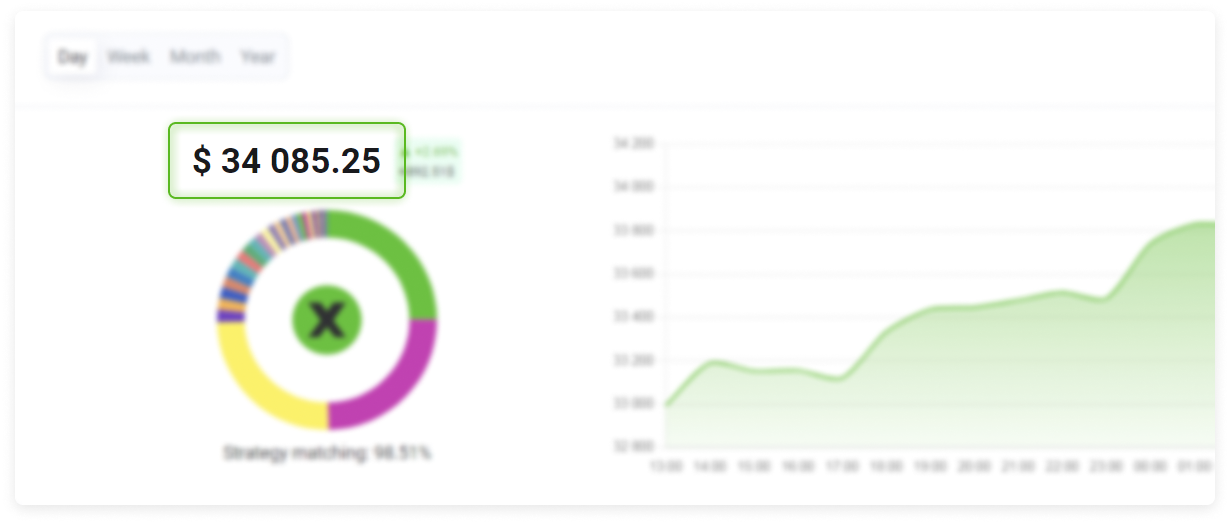
The total portfolio balance is shown in the base currency, either USDT, USDC, BUSD or BTC. This can be changed in Profile Management.
The profitability for the selected TWR period is shown next to the total balance.
Time-weighted return (TWR) is an investment indicator that reflects the return of a portfolio independent of future funds withdrawals from or deposits to the portfolio.
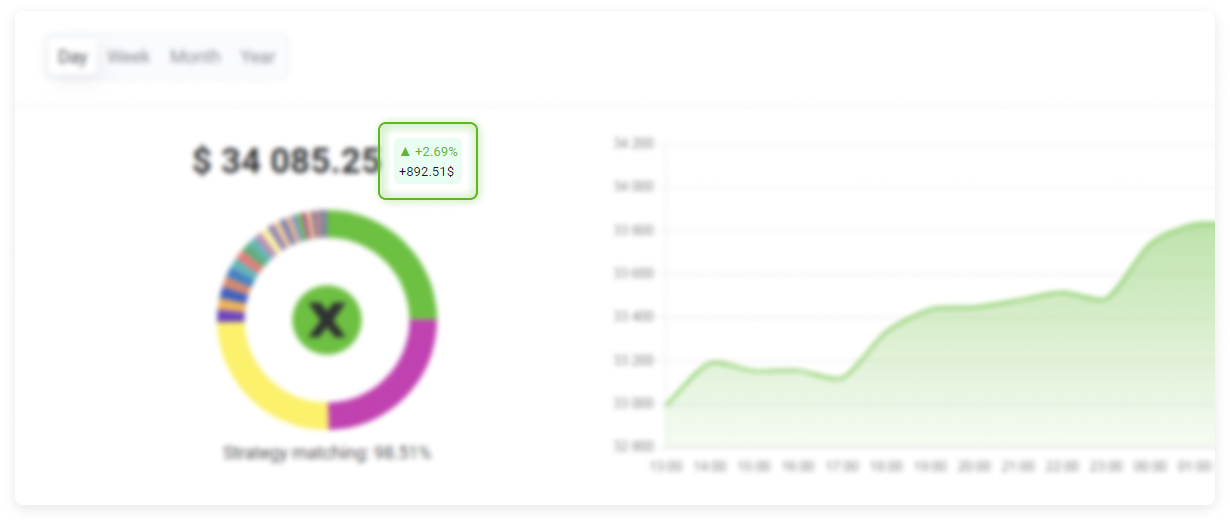
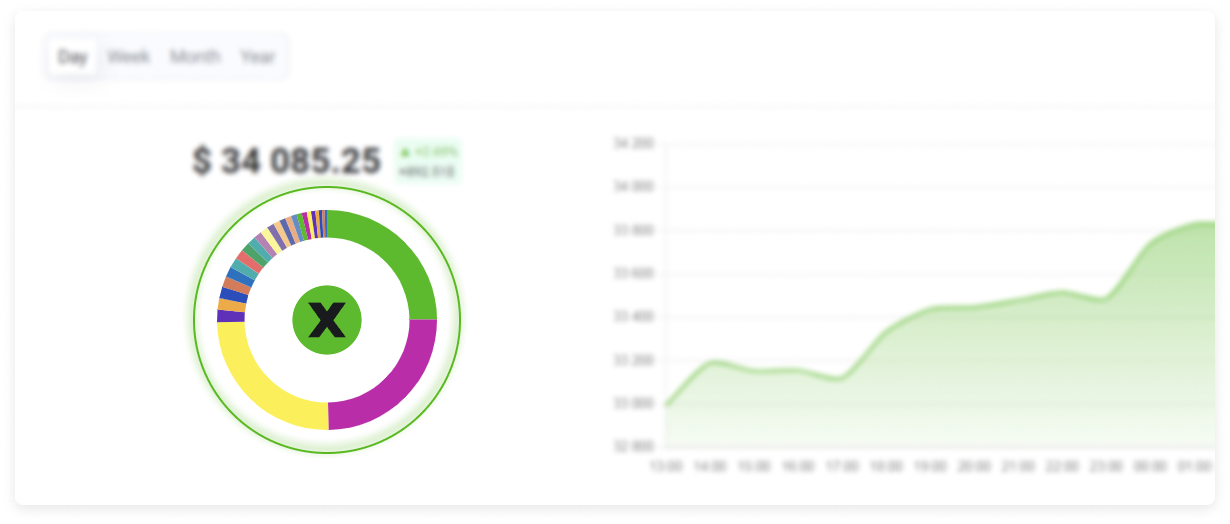
The structure graph visualizes the contents of the portfolio to represent the ratio of assets within it.
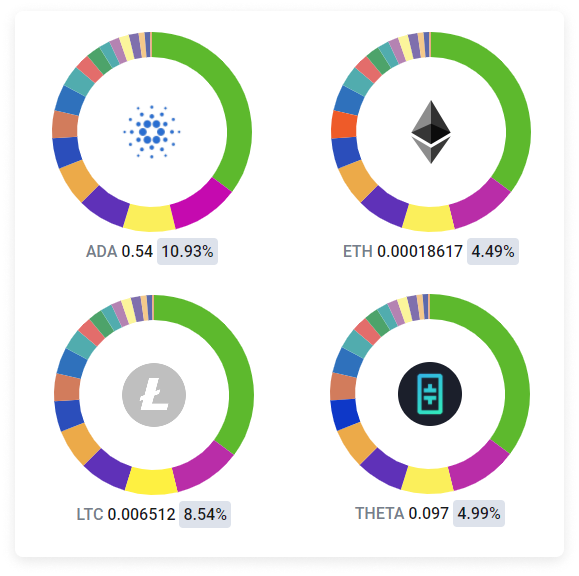
The diagram itself is interactive. Hovering the mouse cursor over an asset share will show:
The ticker, or the abbreviation of an asset in the exchange information:
Quantity;
Percentage ratio;
And the graphic symbol for the asset in the center of the diagram.
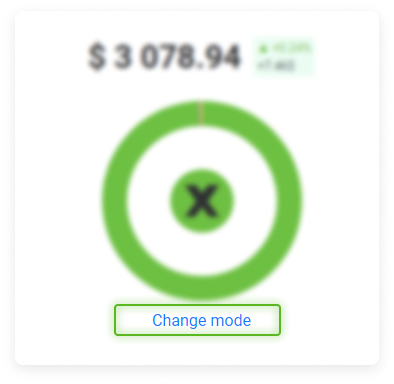
When the strategy is active, the structure graph shows compliance with the assigned strategy.
The example shows 98.51% compliance with the strategy. The structure may not be in line with the strategy due to a change in the share of one or more assets and an outstanding rebalancing after the change.
95–99% strategy compliance is considered normal.
Minus 100% strategy compliance is possible if the account does not have any of the currencies required by the strategy.
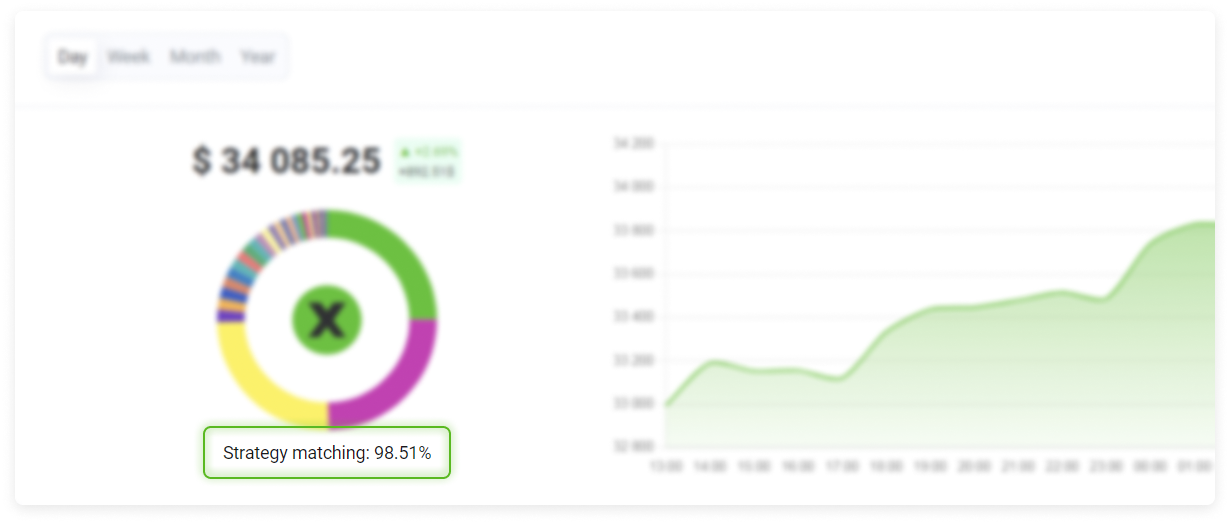
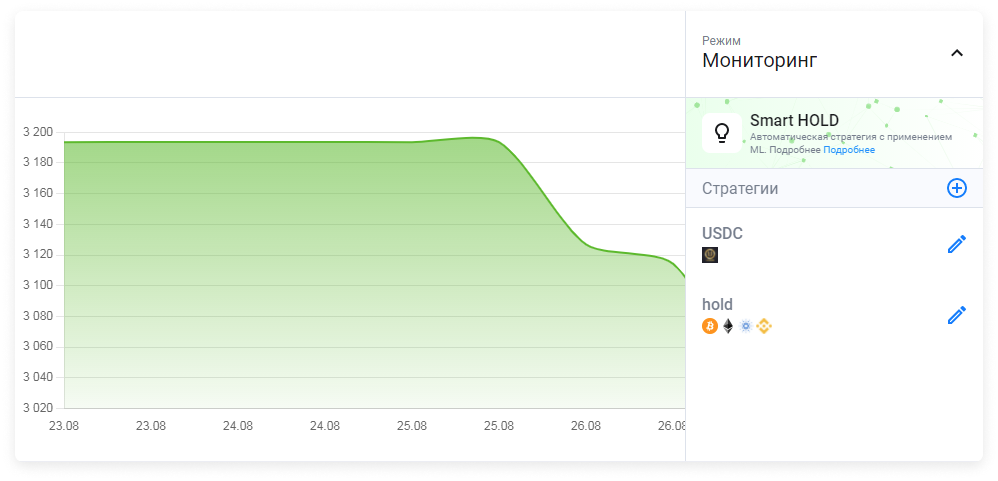
If the Monitoring mode is active, then instead of Strategy matching you will see the option Change mode.
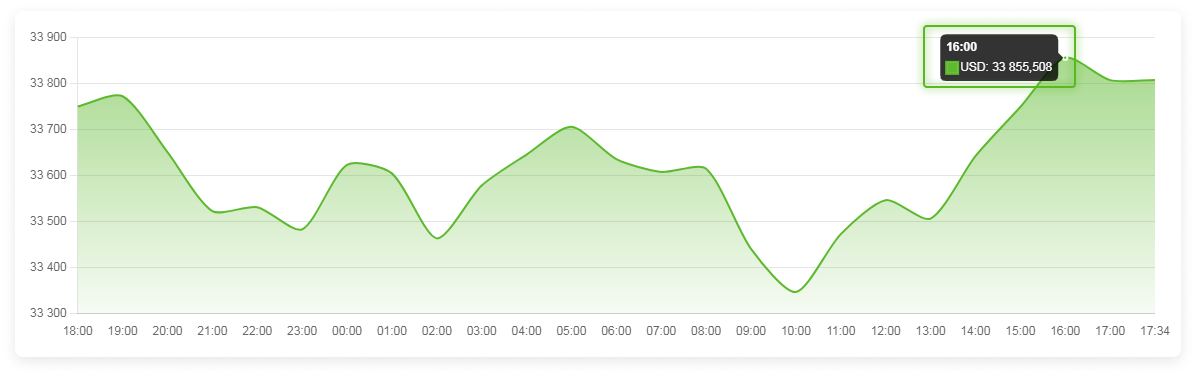
The right side of the statistics shows the current balance status at the selected point on the chart. The balance is affected by:
Deposits;
Withdrawals;
Changes in portfolio value due to price fluctuations.
When you select a point of interest on the chart, it will show the date and the total value of the portfolio in the base currency.
You can find a drop-down list of modes above the graph.
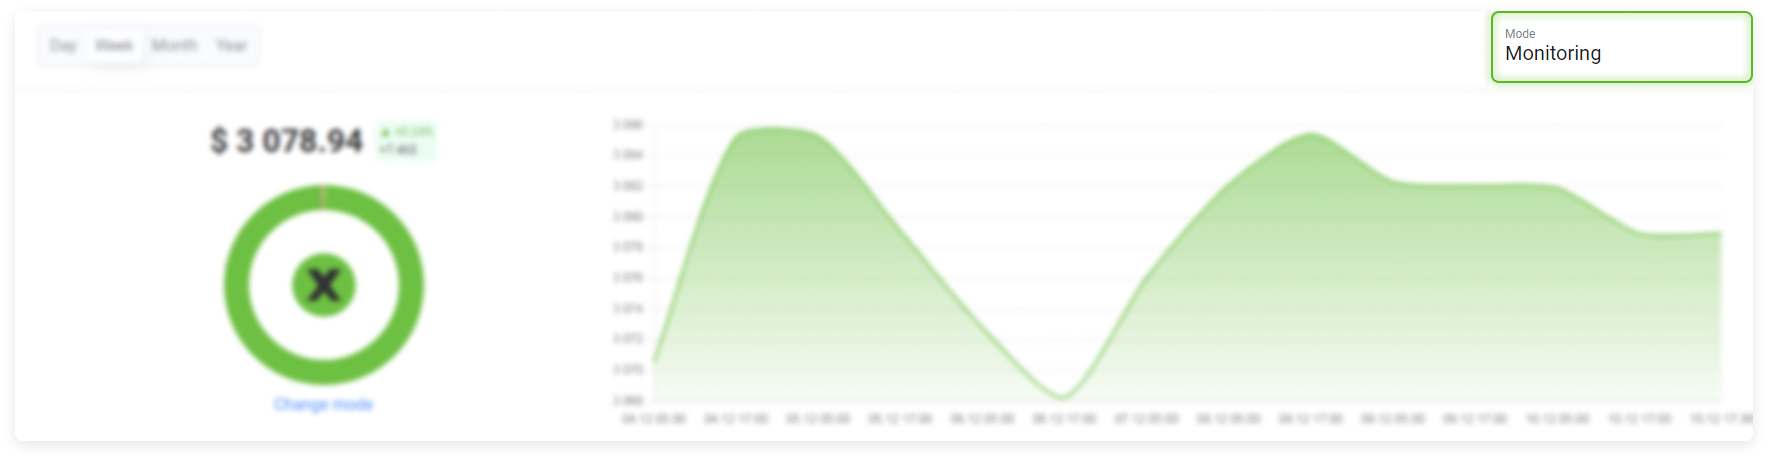
It allows you to quickly switch from Monitoring mode to Smart Hold or one of your own custom strategies.