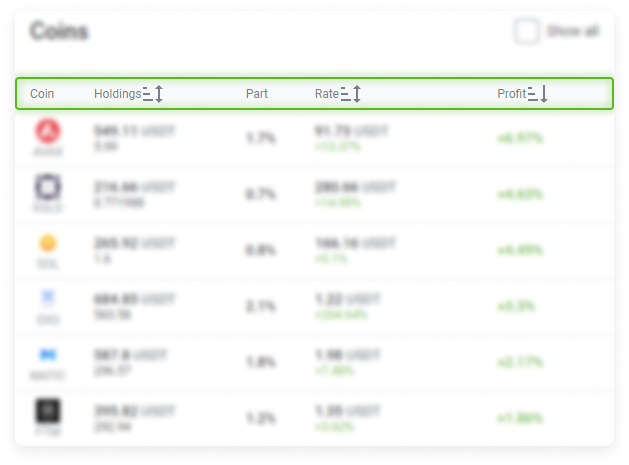
The Coins table shows all assets in the exchange account balance.
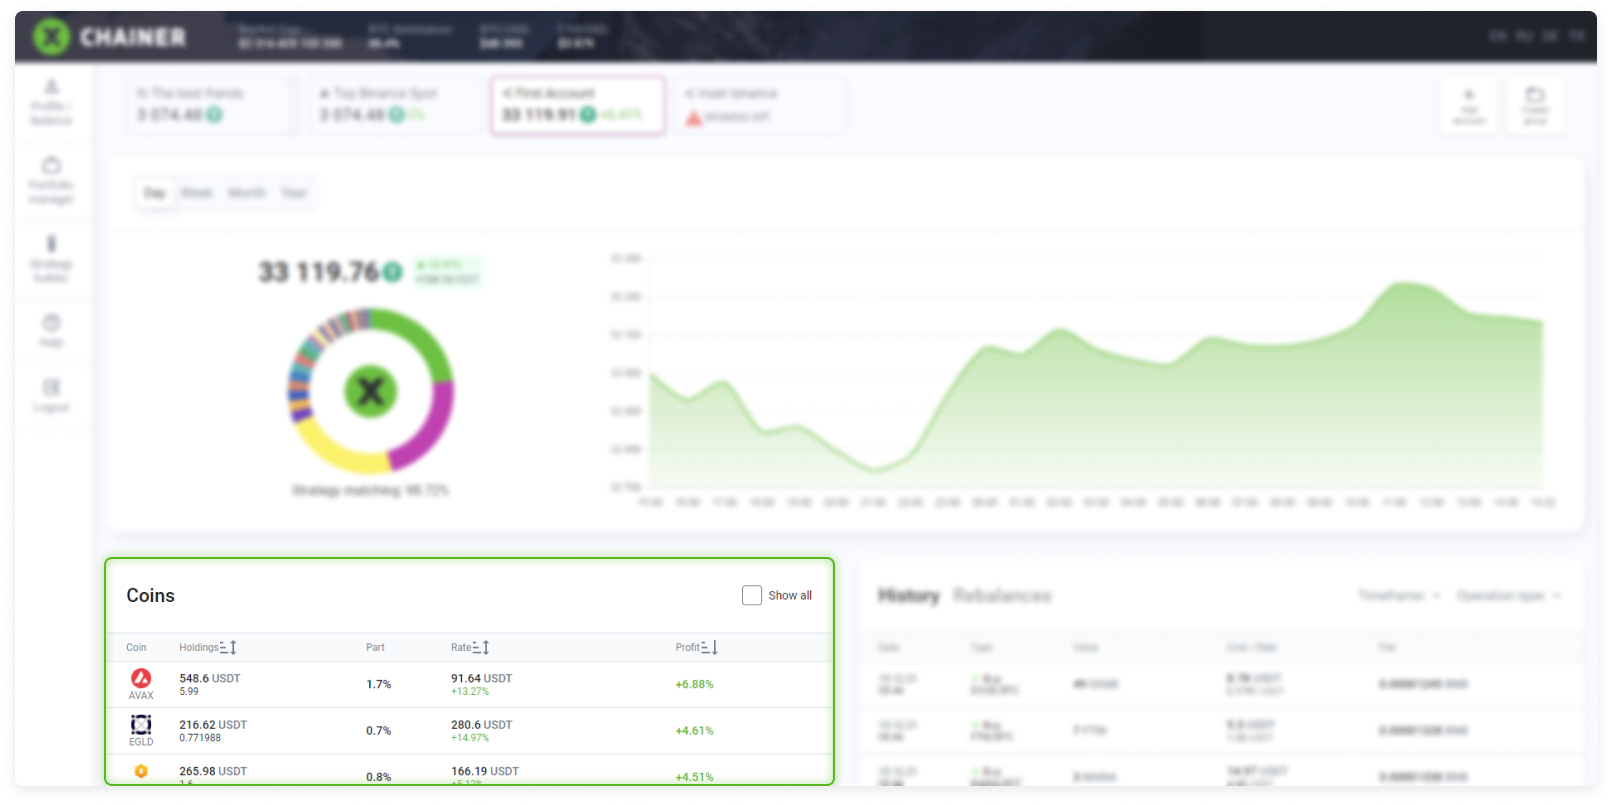
Please note: The converted currency balance in most cases will be slightly different from the balance shown in the exchange account. XChainer does not calculate the value of an asset at the current exchange price, but rather weighs the value of the asset based on the exchange's list of buy offers in real time. The user knows the exact amount at which assets may be converted at any given time.
Checking or unchecking the Show all box enables and disables the display of coins that you hold small shares of (less than 0.1%). Such microbalances cannot be sold, but they can be converted into the BNB token. This can only be done within the Binance exchange account itself.
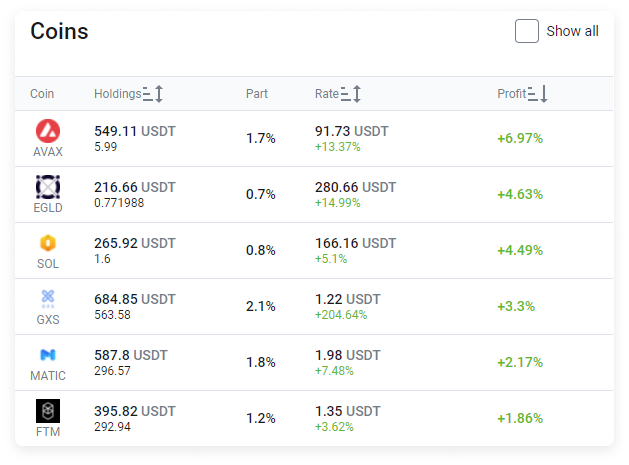
The table consists of five columns:
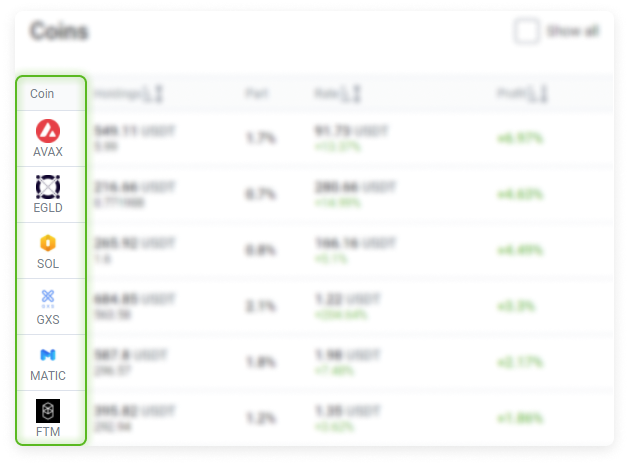
Coins
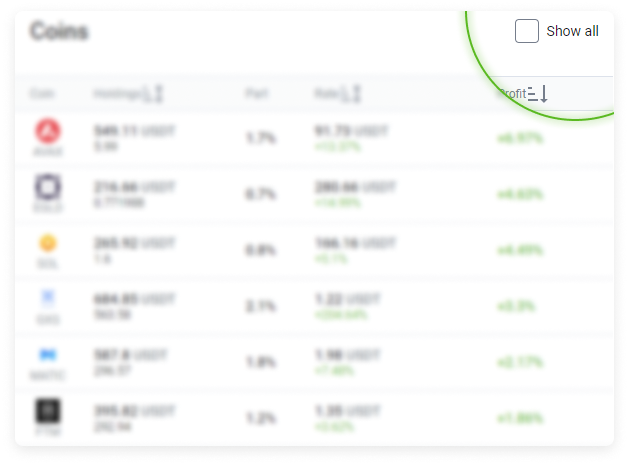
Holdings (sortable in ascending or descending order)
Part
Rate (sortable in ascending or descending order)
Profit (sortable in ascending or descending order)
By default, assets are listed at the top of the table in descending order from those held in the greatest to the least quantity.
Coin. It consists of the ticker for your assets and its graphic symbol.
Holdings. It displays the amount of assets in the balance and their total value.
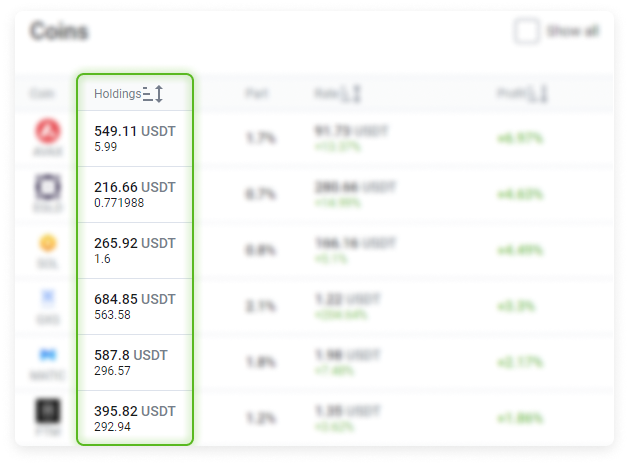
You can sort by clicking the down arrow. By default, assets are sorted by size from largest to smallest.
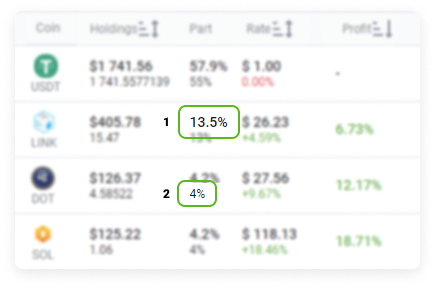
Part. This figure is expressed as a percentage and can have one of two values:
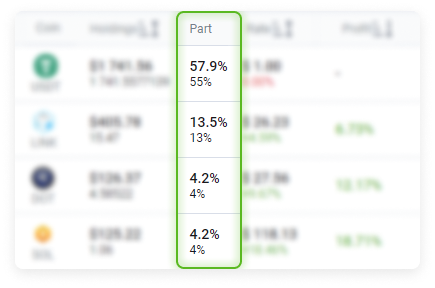
The first option shows the current asset share;
The second option appears when the account is actively following the strategy and shows the weight required by the current strategy.
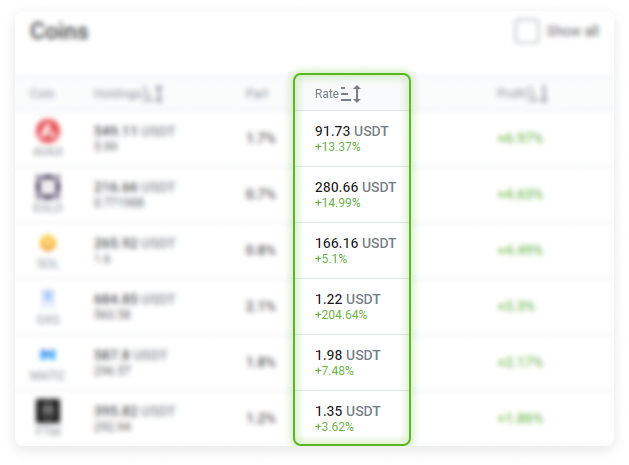
Rate. Current market value per asset unit and percentage change over 24 hours. It is sortable.
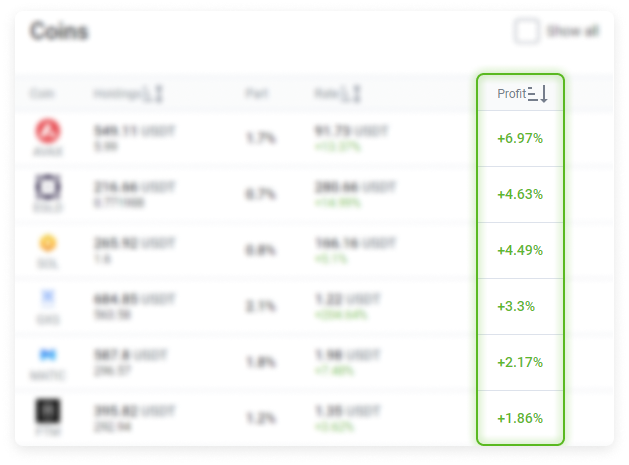
Profit. It is calculated from the transaction history for the asset. It is based on all recent purchase transactions of this asset at its current volume.
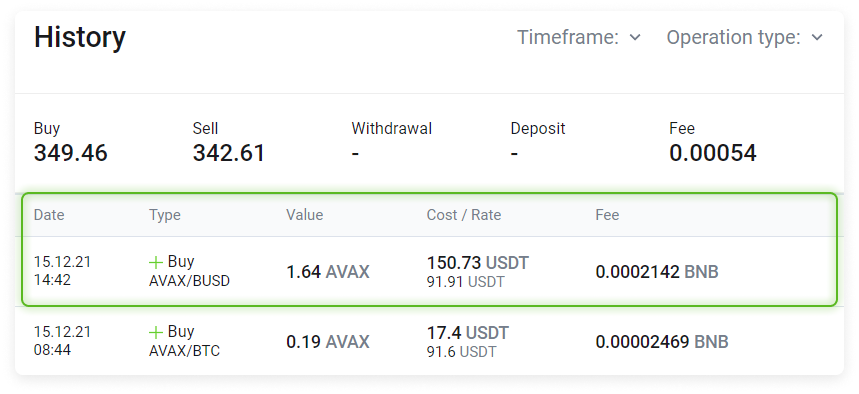
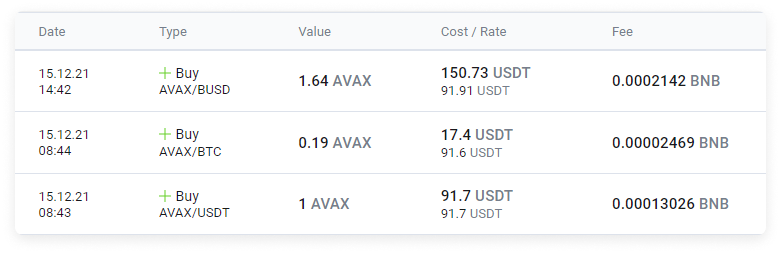
Example of how Profit is calculated.
The Coins table contains an entry recording this amount of AVAX in the portfolio. When we add up the most recent orders in the History table, we can see that this AVAX amount was purchased across 3 transactions at different times and for different prices. We can then calculate the Revenue based on these entries.
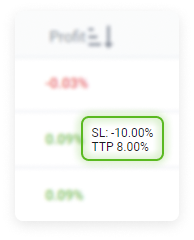
If one or more modifiers (Stop-Loss or Trailing Take Profit) are set, then the Profit column will display their status.
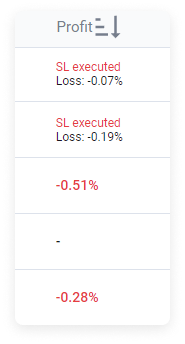
After the Stop-Loss is triggered, SL-executed will be recorded in the Profit column. The asset will then be moved to the beginning of the table, regardless of its size or how the table is sorted.
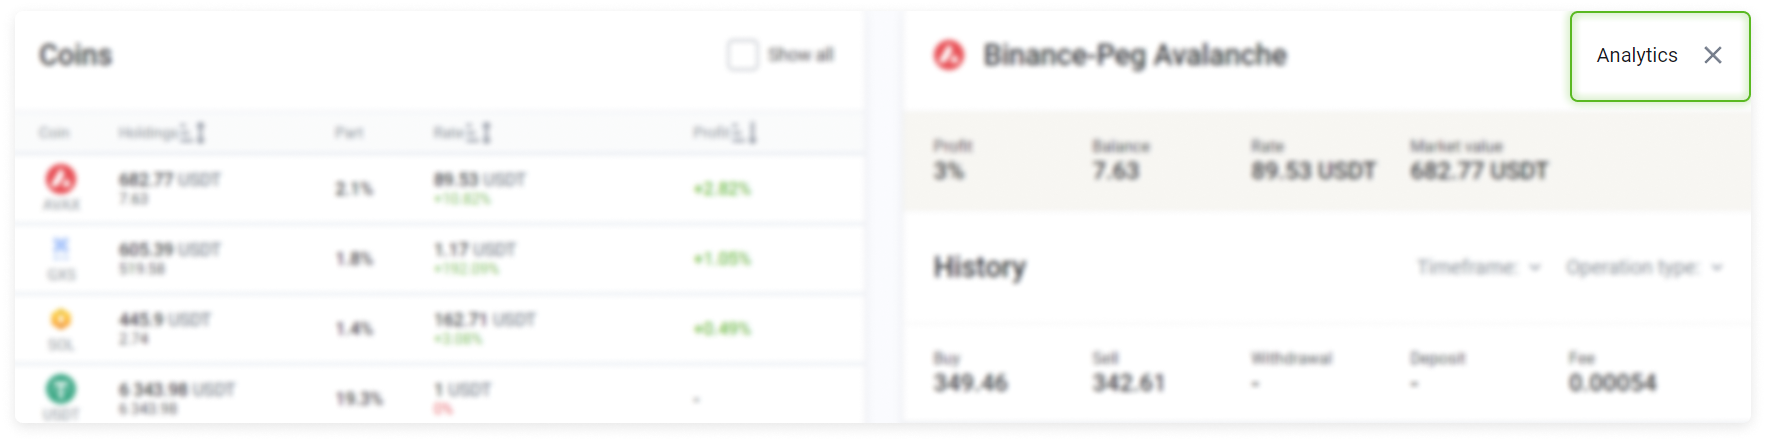
When you select an asset row in the table, detailed information will be displayed on the right side of the screen.
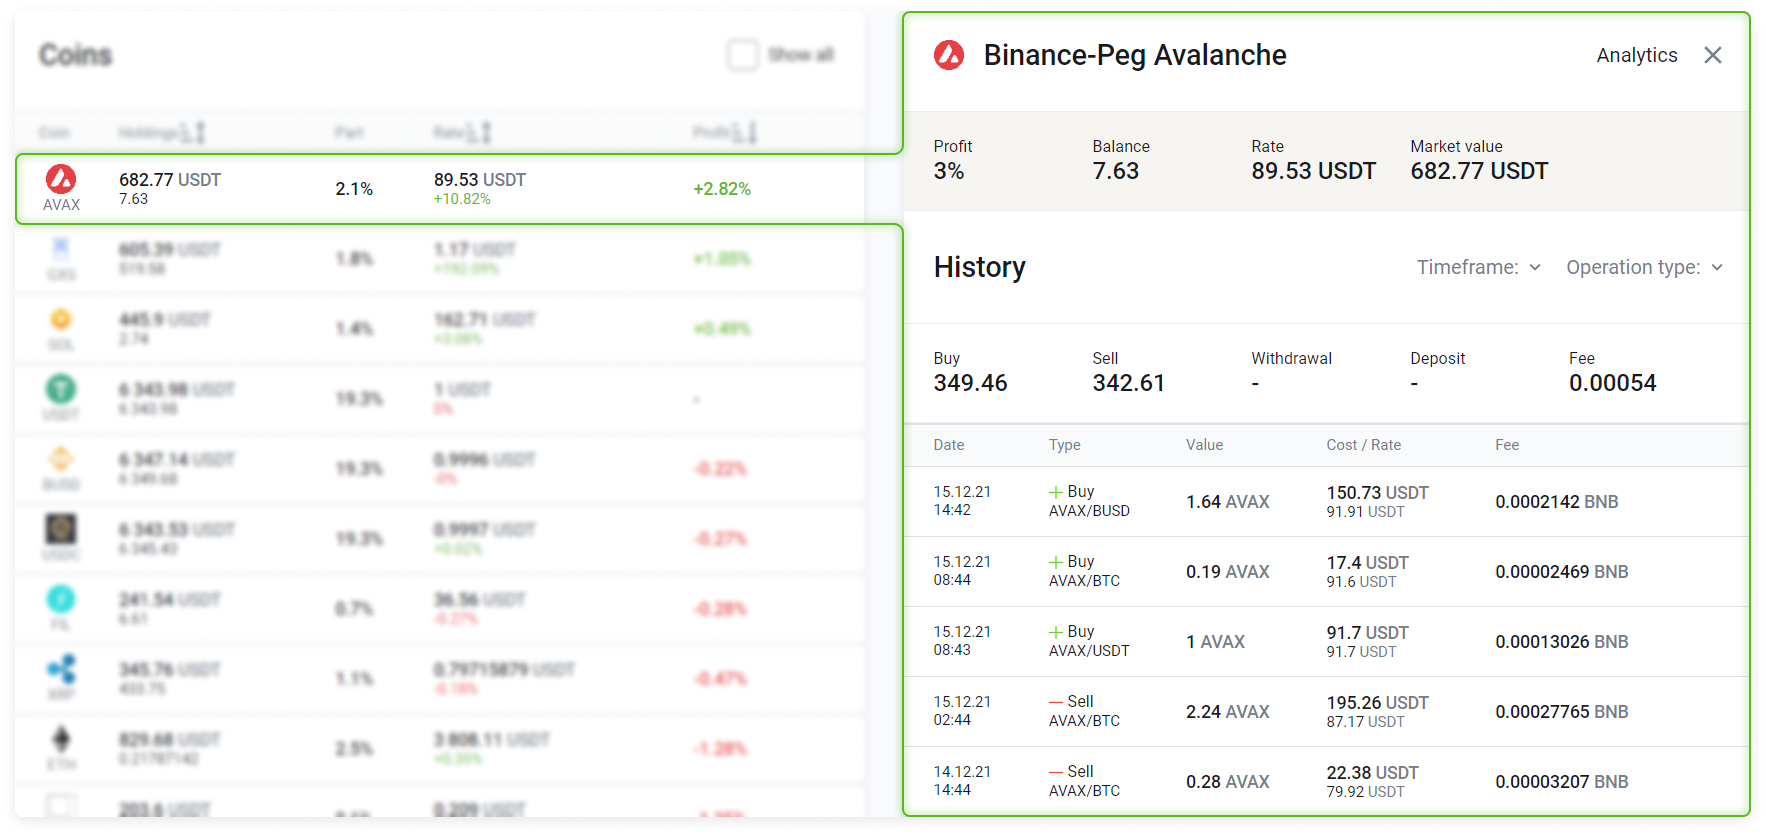
This toolbar provides information about:
Profit
Balance
Price
The market value of the asset in the portfolio
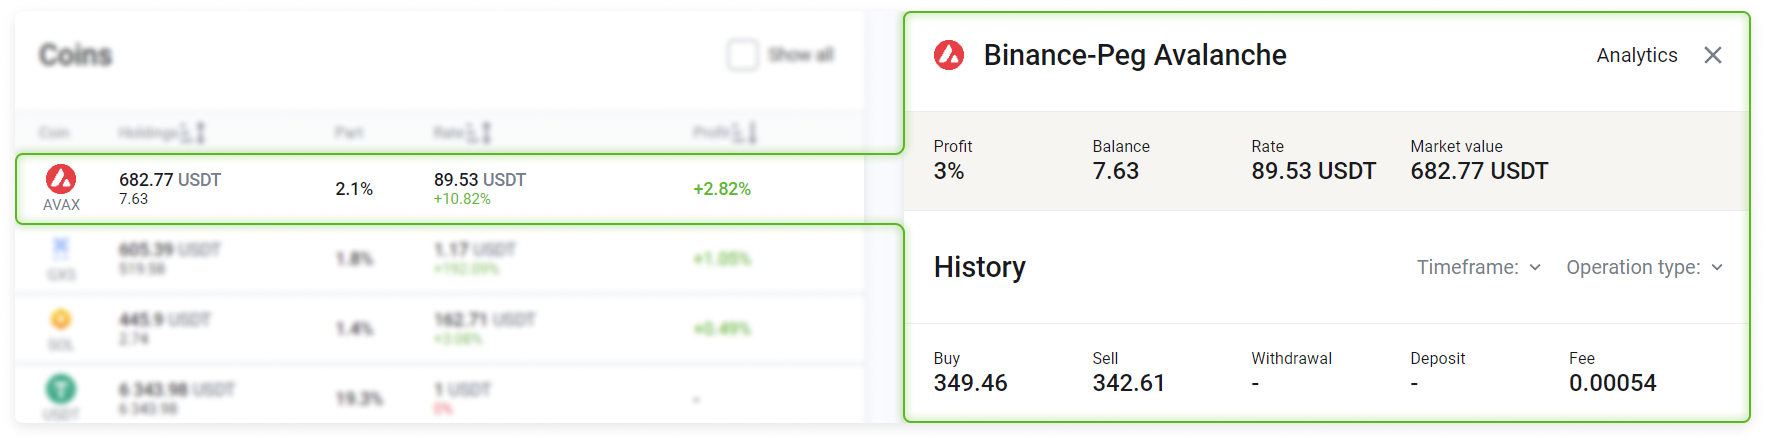
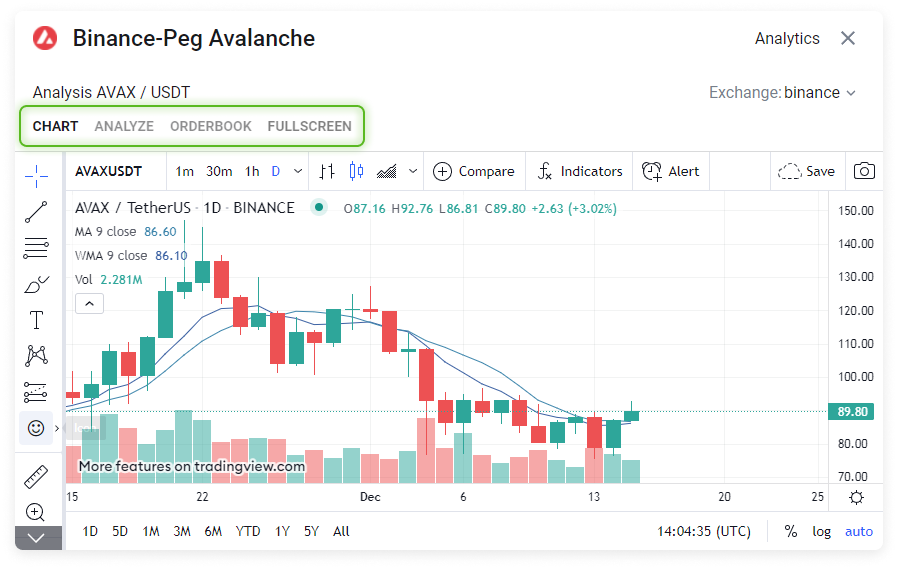
and the ability to obtain analytics from Tradingview. Select Analytics.
A chart will open that will allow you to view your Analysis (with recommendations to buy or sell) or the Order book.
You can see your full transaction history, the total of all purchases/sales, total commission fees incurred, and deposits to and withdrawals from the exchange (deposits and withdrawals are converted on the transaction date).
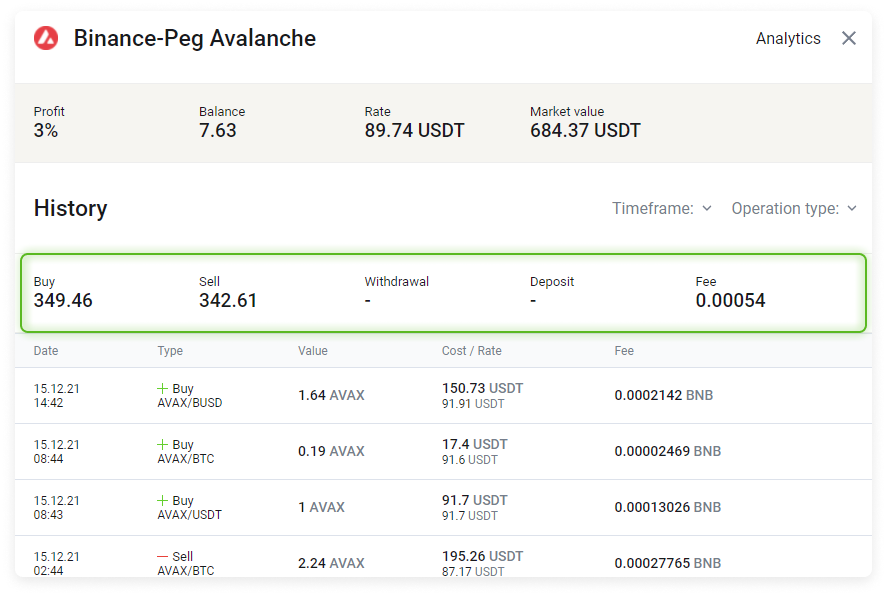
Each row of the History table contains a record for a separate transaction that can be filtered by transaction period and type (for more details, see the History section).
The amounts are converted to the profile base currency, regardless of the transaction trading pair.