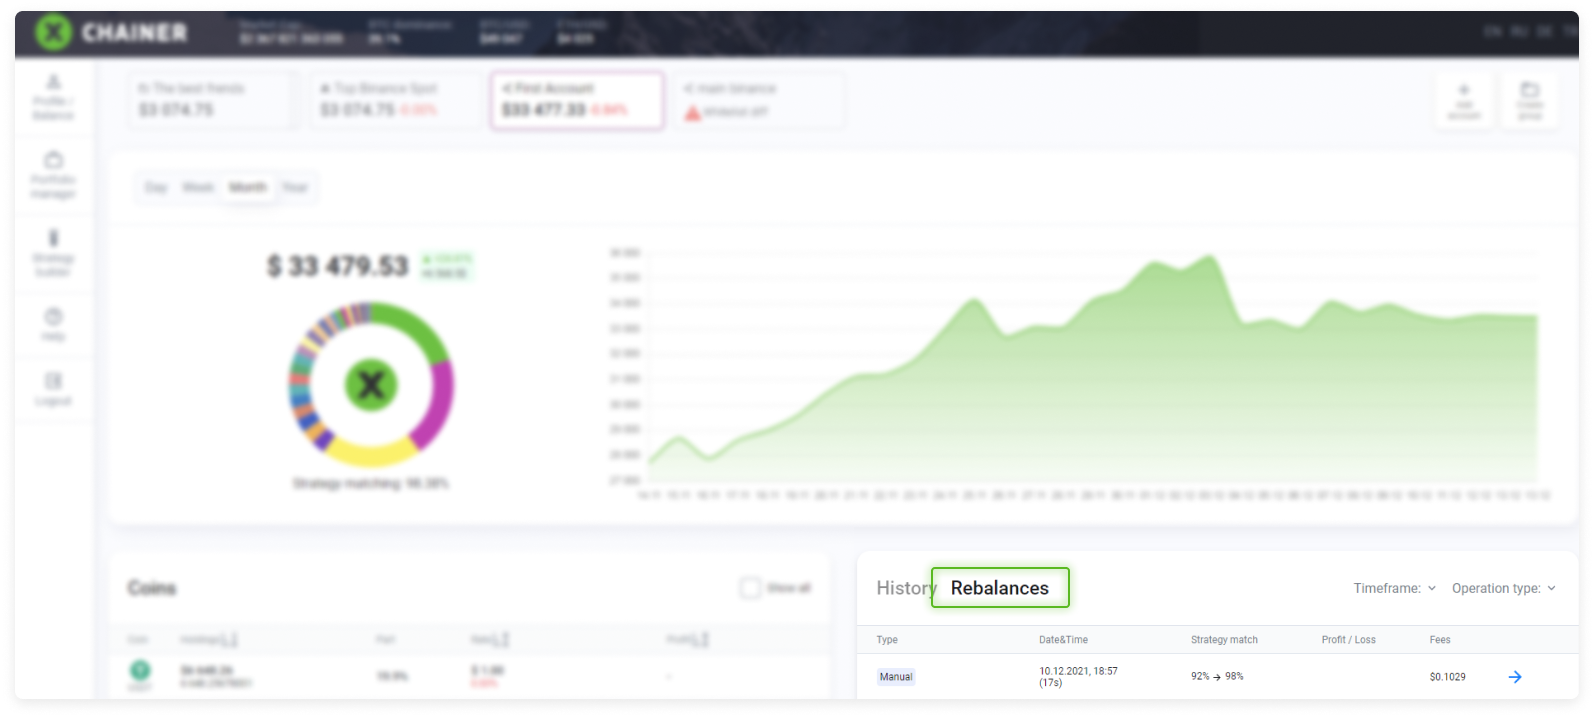
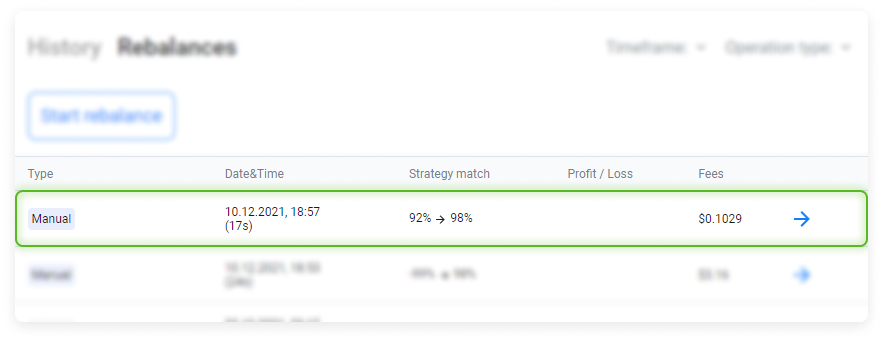
The Rebalancing history table shows all rebalancing session records.
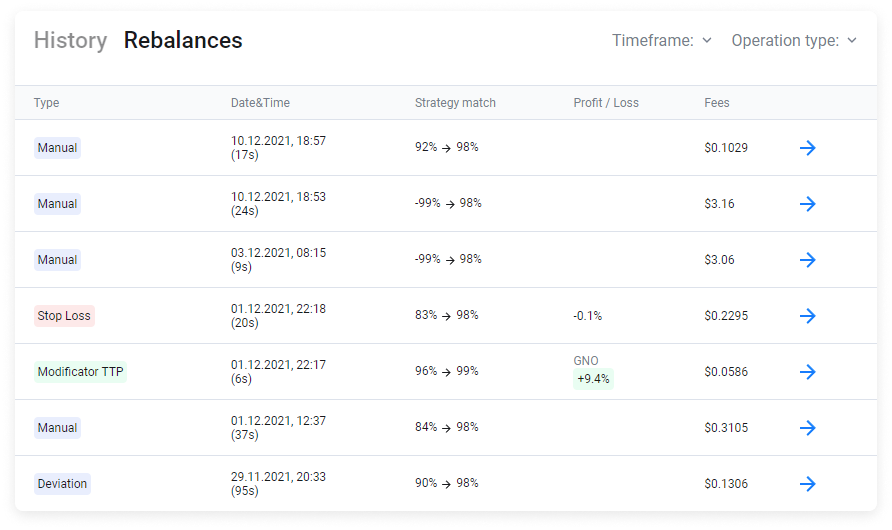
The table contains five columns:
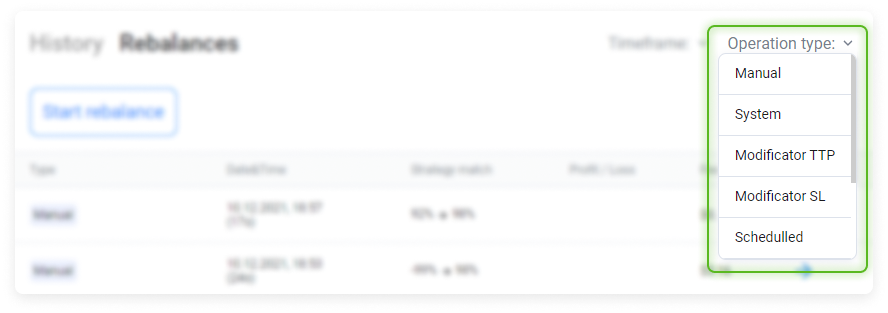
Type.The completed rebalancing type or reason:
Manual. Manual. The user performed a manual rebalancing. For example, they perhaps did so after changing the asset ratio in the Strategy Editor or to restore an asset to their portfolio after its sale using an executed modifier.
System. The system performs rebalancing. This can be prompted, for example, by the user switching the mode from one strategy to another.
SL modifier. The Stop-Loss modifier was triggered, and the asset was sold for the base currency.
TTP modifier. The Trailing Take Profit modifier was triggered, and the asset was sold for the base currency.
Scheduled. The rebalancing was performed according to the schedule set in the Rebalancing section of the Strategy Editor.
Stop Loss. The portfolio Stop-Loss set in the Rebalancing section of the Strategy Editor has been triggered. The portfolio has been completely converted to the base currency.
Deviation. Rebalancing was performed since the asset price deviated from what was set in the Rebalancing section of the Strategy Editor.
Smart HOLD. Rebalancing was performed fully automatically using Smart HOLD mode.
Date&Time. Date and time of the session.
Strategy match.This shows the strategy match before and after the rebalancing.
Profit / Loss. This shows the result of the modifier execution if the trigger was Stop-Loss or TTP.
Fees. The total commission fees incurred for rebalancing trades.

Timeframe. Period filter. This shows your history over a certain period of time.
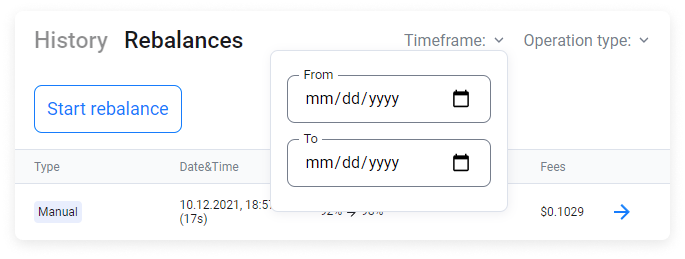
Operation type filter. This shows the history for the selected rebalancing type (reason).
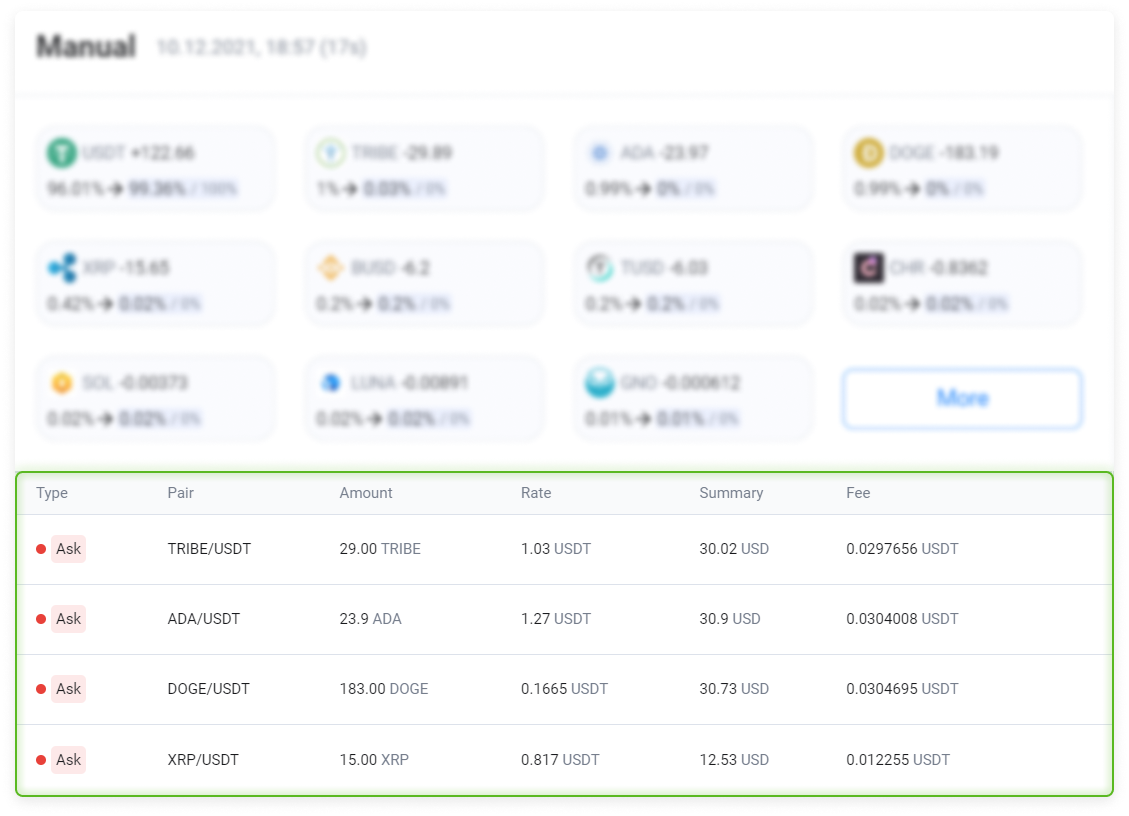
By clicking on a row, you can see detailed information on all orders from the selected rebalancing session.
It replicates all the information that you can find in the corresponding row in the Rebalancing history table, and it also shows detailed information.
The cells are sorted by the amount of the difference between the initial and target state of the asset share in the portfolio. The very first cell will be the cell where the share of the asset has changed the most, and then transactions will be listed in descending order by size.
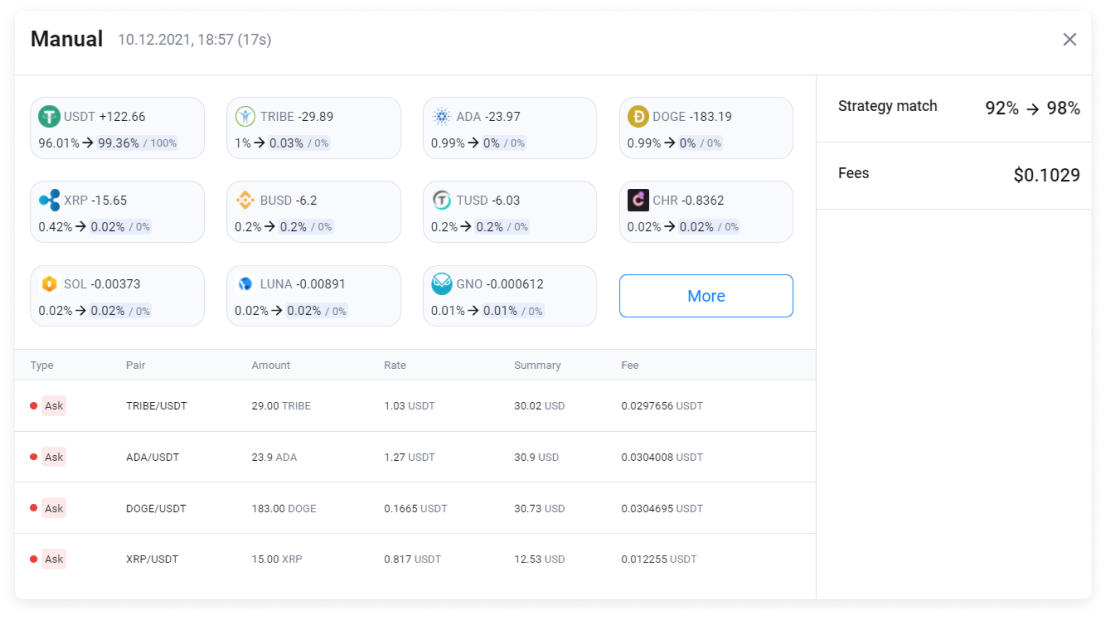
The asset cell contains its graphical symbol, the ticker, the indicators describing how the asset has changed (during rebalancing sessions, the size can either increase or decrease), and the asset ratio before and after rebalancing.
Example. A target of 0% is shown. In fact, 0.03% was achieved. Prior to starting rebalancing, the TRIBE share in the portfolio was 1%. As a result of execution, it should have achieved 0%. However, TRIBE instead achieved a 0.03% share in the portfolio.

The lower part of the detailed description shows completed trades during this rebalancing session.